Mapping points

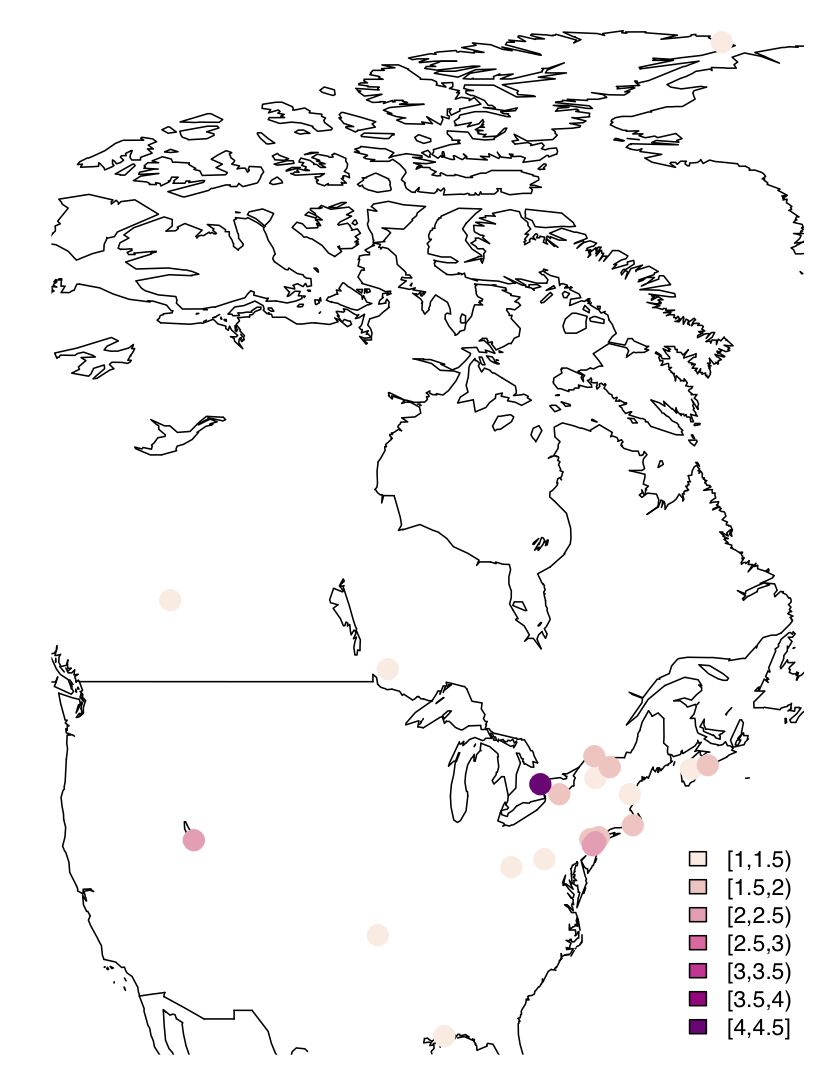
Since I look at mercury concentrations at different measurement stations in North America, visualization using a map with values (of your favourite parameter) plotted as colour-coded circles is quite useful. After some trial & error, here is some very basic code to do this –

I have adapted a recipe from the Dept. of Geography, University of Oregon

# Load packages
library(maps)
library(maptools)
library(RColorBrewer)
library(classInt)
library(gpclib)
library(mapdata)

# Define vector with the values that you would like to see plotted at desired lat/long. Your csv input file loaded as dataframe (Var) must feature the following columns (Site is optional, but useful for labeling)
Site,Para,Lat,Long
plotvar <- Var$Para

# Define number of colours to be used in plot
nclr <- 7

# Define colour palette to be used
plotclr <- brewer.pal(nclr,"RdPu")

# Define colour intervals and colour code variable for plotting
class <- classIntervals(plotvar, nclr, style = "pretty")
colcode <- findColours(class, plotclr)

# Plot the map with desired lat/long coordinates and data points with colour coding and legend
map("worldHires", xlim = c(-125, -55), ylim = c(30, 83))
points(Var$Long, Var$Lat, pch = 16, col= colcode, cex = 2)
legend("bottomright", legend = names(attr(colcode, "table")), fill = attr(colcode, "palette"), cex = 0.7, bty = "n")

And here is the result:

r_plotting


ICMGP mercury conference paper

I will be presenting a paper (as a tlak) at the 10th International Conference on Mercury as a Global Pollutant (ICMGP) at the Convention Centre in Halifax, Nova Scotia:

G. Kos, A. Ryzhkov and A. Dastoor,
Analysis of Uncertainties in Measurements and Model for Oxidised and Particle-bound Mercury

Abstract: Hg2011-a558
Session: S3(II) The North American mercury speciation networks: Analysis and modeling results
Date & Time: Friday, July 29, 2011; 11:30-11:45

I will present a summary of measurement and model-related uncertainties together with modified GRAHM model runs and a comparison with observations from AMNet and Canadian mercury speciation instruments at different sites in the US and Canada.

Unable to plot a decent x-Axis in a time series plot using zoo

I use the R package zoo to plot a yearly time series of weekly averaged data. The problem is that my date variable (m.all$date) contains week numbers and these are plotted as x-Axis. What I would rather like to to is plot abbreviated months.

I can suppress the x-Axis in the plot using xaxt = "n" in the plot.zoo command, but cannot define a suitable x-Axis that plot abbreviated months instead.

I tried several variations of the axis.Date() commands without luck!

# Create zoo object for time series plot
z < - zoo(cbind(m.all$obsTPM, m.all$modTPM, m.all$refTPM), m.all$date) names(z) <- c("Observation","Model estimate", "Model reference") # Plot plot.zoo(z[, 1], type = "l", lwd = 1, col = "black", screens = c(1), xlab = "Date (2005)", ylim=c(m.all$obsTPM,m.all$modTPM, m.all$refTPM), ylab = "Concentration (pg m-3)", main = "Alert TPM: Observations vs. Model Estimates, Weekly Means") lines(z[, 2], lty = 5, lwd = 1, col = "blue") lines(z[, 3], lty = 3, lwd = 1, col = "red") legend("topleft", lty = c(1,5,3), legend = colnames(z), bty = "n", col = c("black","blue","red"), lwd = 1)

More fun with sed

So I have this strange date and time string, which I would like to convert to a “useable” date, i.e., something that a spreadsheet programme or R can work with. It looks like this (MON has 3 chars):

ddMONyr:hh:mm:ss

The string is the second field in a csv file, preceded and followed by a comma.

My strategy was to terminate the string before the first colon and delete everything thereafter to be left with the following string (with one occurrence in each of the about 6000 lines of the file):
ddMONyr

sed does this in a single line (looks kinda ugly, but does the trick):
sed 's/:[0-9][0-9]:[0-9][0-9]:[0-9][0-9]//g' myfile.csv >myfile2.csv

Contribution at upcoming AGU Fall Meeting

I will be presenting a paper at the upcoming AGU Fall Meeting as part of the OASIS session A08: Ocean-Atmosphere-Sea Ice-Snow (OASIS) Interactions in Polar Regions: Results From Recent Field Campaigns:

Gregor Kos, Adechina Nafissa, Dwayne Lutchman, Roya Mortazavi, Parisa Ariya
(Semi)volatile Organic Compounds and Microbiological Entities in Snow during OASIS Barrow 2009

Abstract ID 723572
I will not be able to present myself, but one of the co-authors will be there to present the poster.