Converting a scientific manuscript from LaTeX to MS Word

I like to write my manuscripts in LaTex — focus on the text and no worries about figure and table numbers, their formatting… have me sold. But sadly, not all journals accept LaTeX source files, some even require the us of MS Word. So, here is, what I have done to get a manuscript ready for submission on a Mac .

My manuscript contained

  • Tables (including “sidewaystable”)
  • Figures
  • Bibliography generated with natbib

I needed

  • MacTeX 2016
  • Preview
  • MS Word
  • SimpleTeX4ht

What I did

  • Copy/paste the manuscript in PDF format from Apple Preview into MS Word (looks surprisingly good). This makes sure to bring the references properly along
  • Clean up the text, replacing e.g., words breaking in the middle of the line (from the PDF line wraps); can be mostly done using find/replace
  • Reapply bold and italics text not carried over from copy/paste
  • Use SimpleTeX4ht to export an HTML file and copy/pasting the tables to the MS Word file, where it is reformatted properly. Not as tedious as it sounds.
  • Figures are copied/pasted from the PDF, but they need to be resized.

Open issues

  • Super- and sub-scripts are not properly copied over; they look fine in MS Word, but do not correspond to a true MS Work sub/superscript. Cannot be fixed using MS Word’s find/replace function either since it is a formatting issue. Needs to be changed manually (… or ask the copy editor nicely, if s/he could do it).
Here is to Reviewer 2!

In a recent manuscript, now under revision, Reviewer 2 suggested to provide more detail on the already published and cited reference method used — well here we go (again): Too detailed? I will be asked to shorten and be more concise; too concise? I will be asked to expand.

 Middle ground seems to be hard to find — or rather seems to be a function of how willing Reviewers are to look up cited literature. 
I’d rather go with short, sweet and properly cited — at least next time, when I will be Reviewer 2 😉

Canada-wide Science Festival

I was the departmental coordinator for the Canada-wide Science Festival, which was held at McGill this year. Geared at high school students it is also a great outreach opportunity for university departments to provide information to prospective students. 

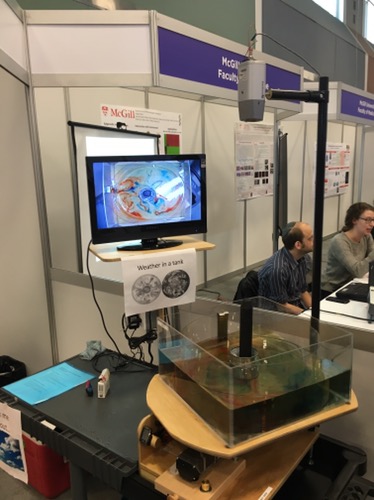
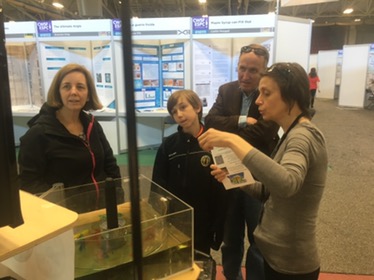
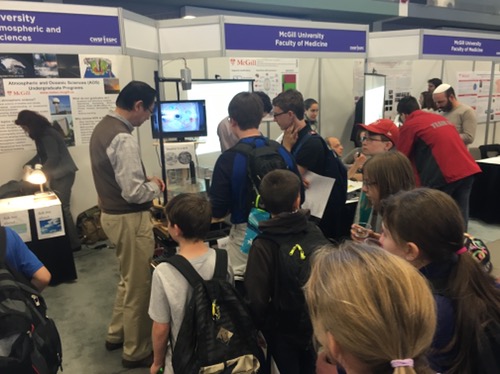
Things got quite crowded during the day with the weather in a tank set-up being a magnet for students and teachers alike. 

A can of ice is placed in a rotating water tank. The temperature gradient together with the rotation creates flows (visualized with food coloring) that are strikingly similar to atmospheric patterns in the mid-latitudes, where the temperature gradient is caused by the warm regions near the equator and the cold poles.

There was also a display about how melting sea ice does not contribute to sea-level rise, but melting glaciers do. We also demonstrated the sea ice albedo effect with a lamp and thermometers placed near black and white paper.

The Canadian Mercury Science Assessment is now published

The assessment provides current information about Hg emissions, transformation and environmental impact from a Canadian perspective.

I was the lead author of the “Emissions” chapter of the report and together with D. Niemi and Y. Fan-Li, I have summarized past, current and projected future emissions using Canadian and global data.

Find a summary here: http://www.ec.gc.ca/mercure-mercury/default.asp?lang=En&n=32909A5D-1

Talk at the MUSCLE Cluster Conference at Bishop’s University

I have attended and presented at the “Connecting Through Climate Change” meeting at Bishop’s University (where I also teach). I was asked to present results from my Arctic Research and very interesting discussions followed with researchers from the Université de Sherbrooke and Bishop’s University.

What’s going on here…today…

Things have been busy in the last few months… and here is why.

Research-wise, I have continued the urban air quality data project, where I statistically analyse 10+ years of hourly pollution data from major Canadian Cities, mostly using Matlab. The modelling component of the project aims at understanding the underlying atmospheric reactions, especially the involvement of halogens. I employ the CAABA/MECCA box model for this task.

I am also finishing up my chemometric modelling work for the MYCOSPEC project. I presented results at the Mycotoxin Summer Talks in Tulln, Austria last summer and at the 5th MoniQA International Conference “Food and Health – Risks and Benefits” in Porto, Portugal last fall.

On the teaching side, I have been teaching Analytical Chemistry (lecture and lab) in the fall and currently Chromatography and the Atmosphere and Ocean lab are on my teaching schedule. Courses are going well and I really enjoy the interaction with students!

This is the paper of the day…

Here is a teaching method, that I initially started using in my “Environmental Chemistry” lecture. It is called “Paper of the Day” and starts out the lecture with a brief (10 min) presentation of a new and relevant research paper that is tightly connected to the following lecture’s content; e.g., a “global warming” paper for the start of the global warming chapter; one of the very new “Arctic ozone hole” papers, when discussing Arctic stratospheric chemistry… well you get the drift.

I have now expanded this to Analytical Chemistry and, especially, the Chromatography lab, using environmental, pharmaceutical, industrial and biochemical/medical applications to illustrate the usefulness of the content presented and provide relevance to students.

Also, students have approached me to discuss a paper (or sometimes even a general media article) several times and I am happy to leave the stage to them, providing context whenever needed.

A new HPLC experiment for the Chromatography lab

I have been looking for a while to replace the rather old-fashioned quantitative HPLC-DAD lab (separation of phenol and acetophenone) at Bishop’s University with a modern and relevant lab for students. So, I stumbled across a paper by Bidlingmeyer and Schmitz (1995), which describes an experiment for

The analysis of artificial sweeteners and additives in beverages by HPLC: An undergraduate experiment

which I have now adapted to a 4-hour lab for Chemistry students. Preliminary trials were successful and the first students will get a hands-on experience with a real life sample in early January!

Working with netCDF data in Matlab

It took a bit of time, but here are some simple procedures to work with netCDF output that I get from my atmospheric chemistry model runs in Matlab.

Here is an example for pollutant concentrations obtained in .nc format from a CAABA/MECCA run:

% Read 4D-double data from .nc file for the following variables
time = ncread('caaba_mecca.nc','time');
o3_data = ncread('caaba_mecca.nc','O3');
oh_data = ncread('caaba_mecca.nc','OH');
no_data = ncread('caaba_mecca.nc','NO');
no2_data = ncread('caaba_mecca.nc','NO2');
ch4_data = ncread('caaba_mecca.nc','CH4');
co_data = ncread('caaba_mecca.nc','CO');

% Extract concentration data from 4D double matrix and write to new variable
o3_data2 = squeeze(o3_data(1,1,1,:));
oh_data2 = squeeze(oh_data(1,1,1,:));
no_data2 = squeeze(no_data(1,1,1,:));
no2_data2 = squeeze(no2_data(1,1,1,:));
ch4_data2 = squeeze(ch4_data(1,1,1,:));
co_data2 = squeeze(co_data(1,1,1,:));

Starting here you can resume regular Matlab code to work with the variables defined

Common elements, when importing pollution and meteorological data

Well, there is only one thing that the data have in common … they are available in csv format. But this is it.

Whether you download from providers such as Metro Vancouver, the City of Montreal, the Ontario Ministry of the Environment and Climate Change (OMECC) or Environment Canada — all of them set up their data tables in a different fashion; data from the OMECC are formatted in an especially exotic fashion (hourly data columns!), whereas other providers basically stick to a date/time column(s), followed by data columns. Hourly data are the norm for Criteria Air Pollutants, but e.g., merging precipitation data, which is reported as cumulative daily value is more challenging.

So — first task is to cut away explanatory lines (if any — I’d rather have these; Environment Canada is pretty thorough here), harmonise data flags (I do this mostly in vim), find out what empty cells are (< LOD?, no data?, units used?… depends on the provider, so find and talk to the responsible person; good luck!), arrange all data in the same fashion and finally merge it into a common data table (in Matlab).

Bottom line: Open data is good, but open data formats and documentation not so much!